Initial Setup
In this guide, we'll walk you through the essential features of the Remnawave Panel, helping you get up and running quickly.
We will cover every step, from your first login to the Panel to importing a subscription into a client application.
- This guide is written for Panel version 2.0 and newer.
- This guide also assumes that you have already installed Remnawave and its components.
- Some UI elements have changed their appearance in recent updates, but don’t worry — the functionality is largely unchanged, and this guide remains up to date.
Getting Started
After you've installed the Panel and its necessary components, the admin interface will be accessible through browser — navigate to the domain you've assigned the Panel to.
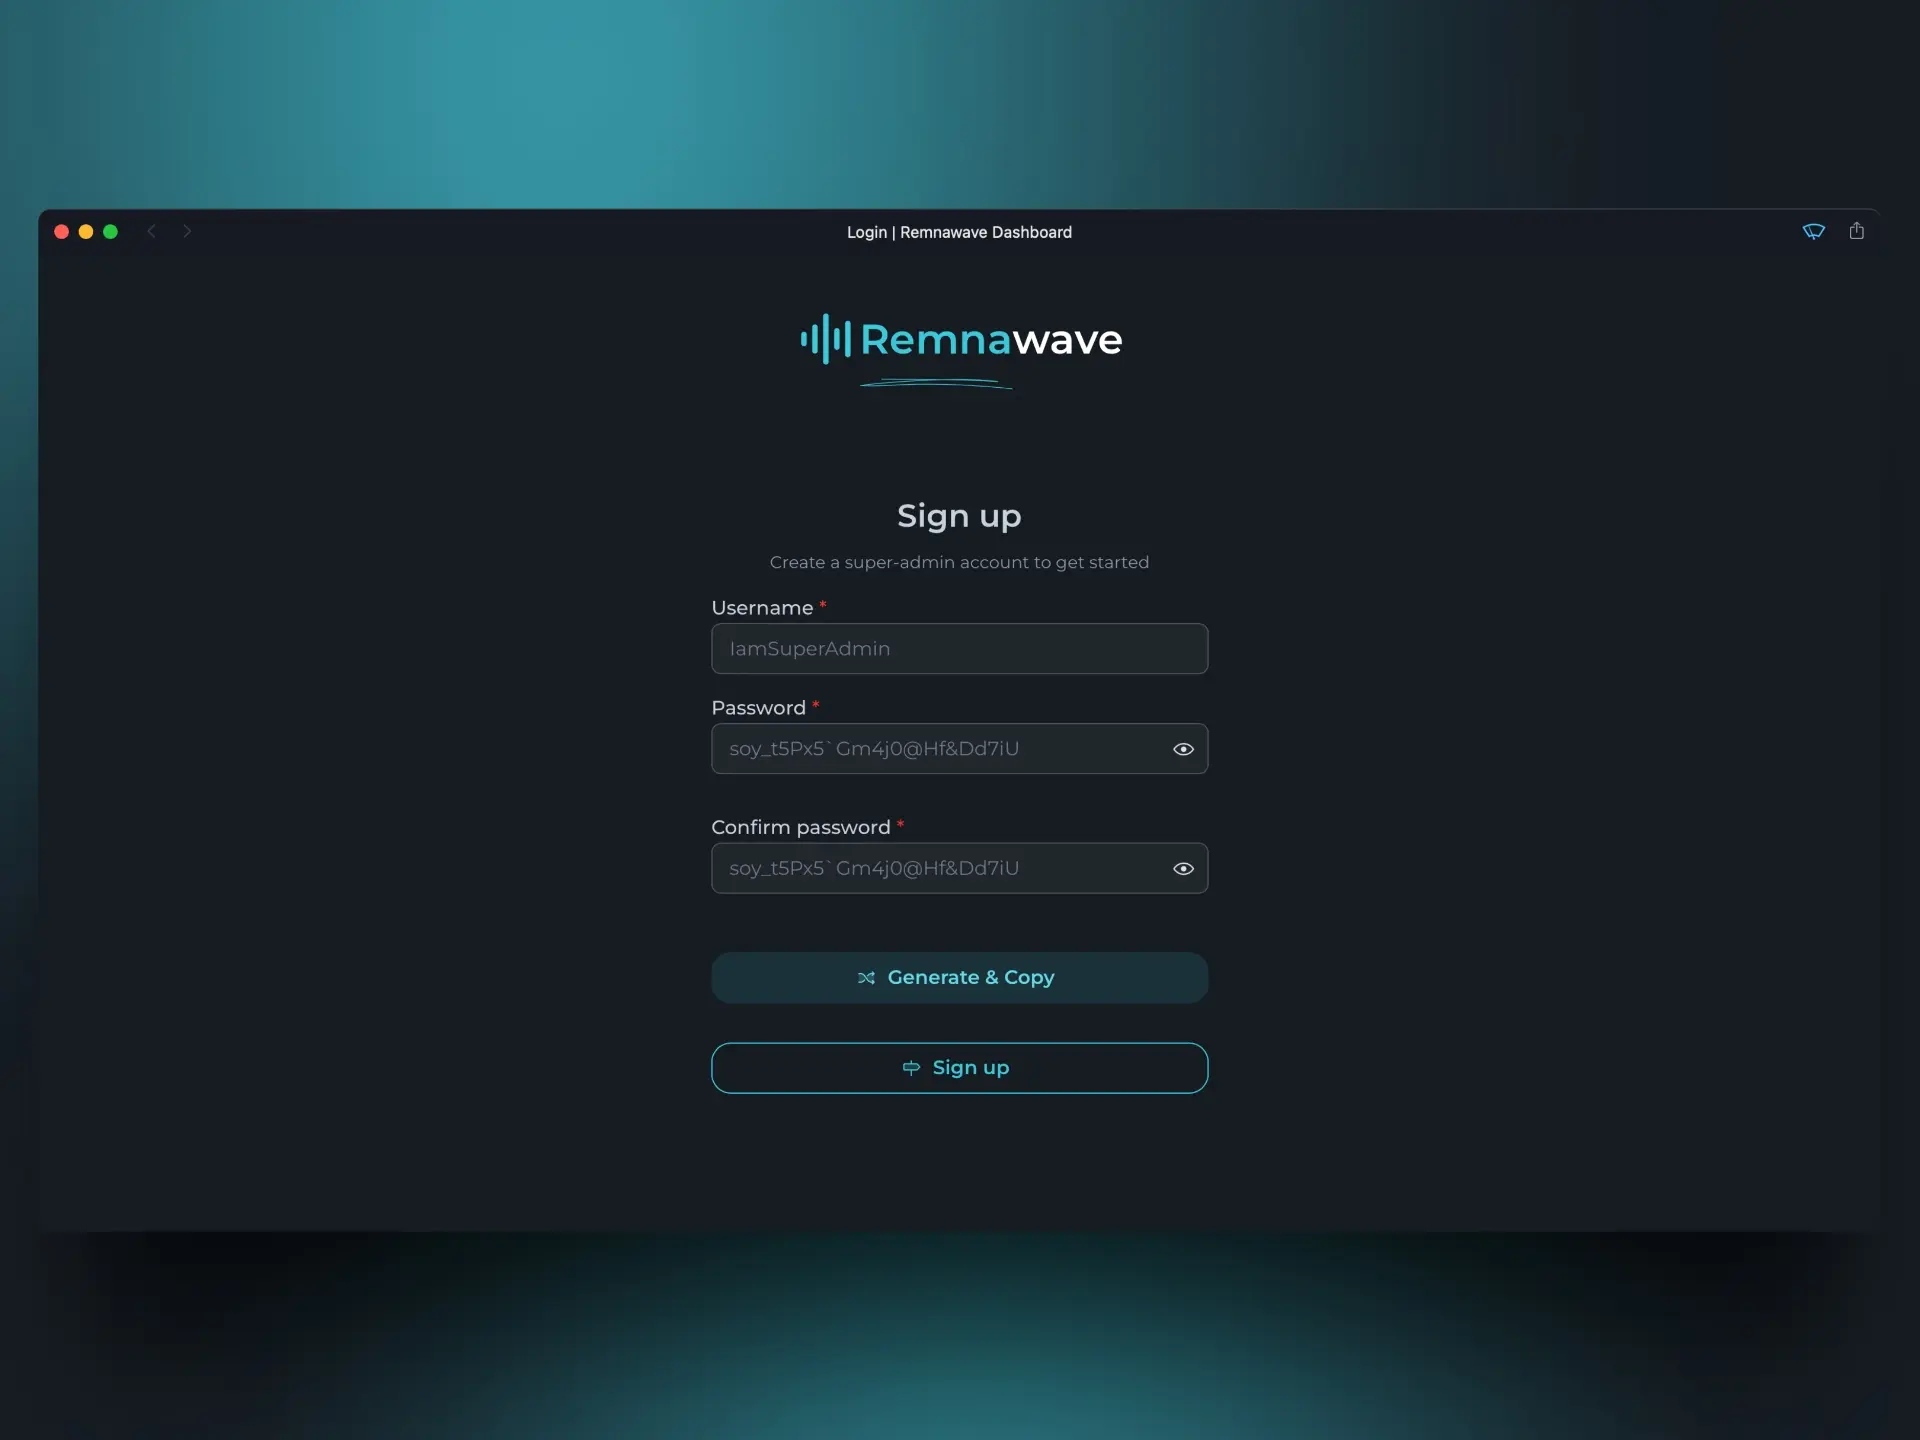
First, you need to create a user. The first user to register automatically becomes the "super-admin."
If you ever forget your password, you can always recreate the super-admin account using the Rescue CLI.
To access the Rescue CLI, use the command: docker exec -it remnawave remnawave-rescue-cli
Home Page
After registration, you will be taken to the main dashboard.
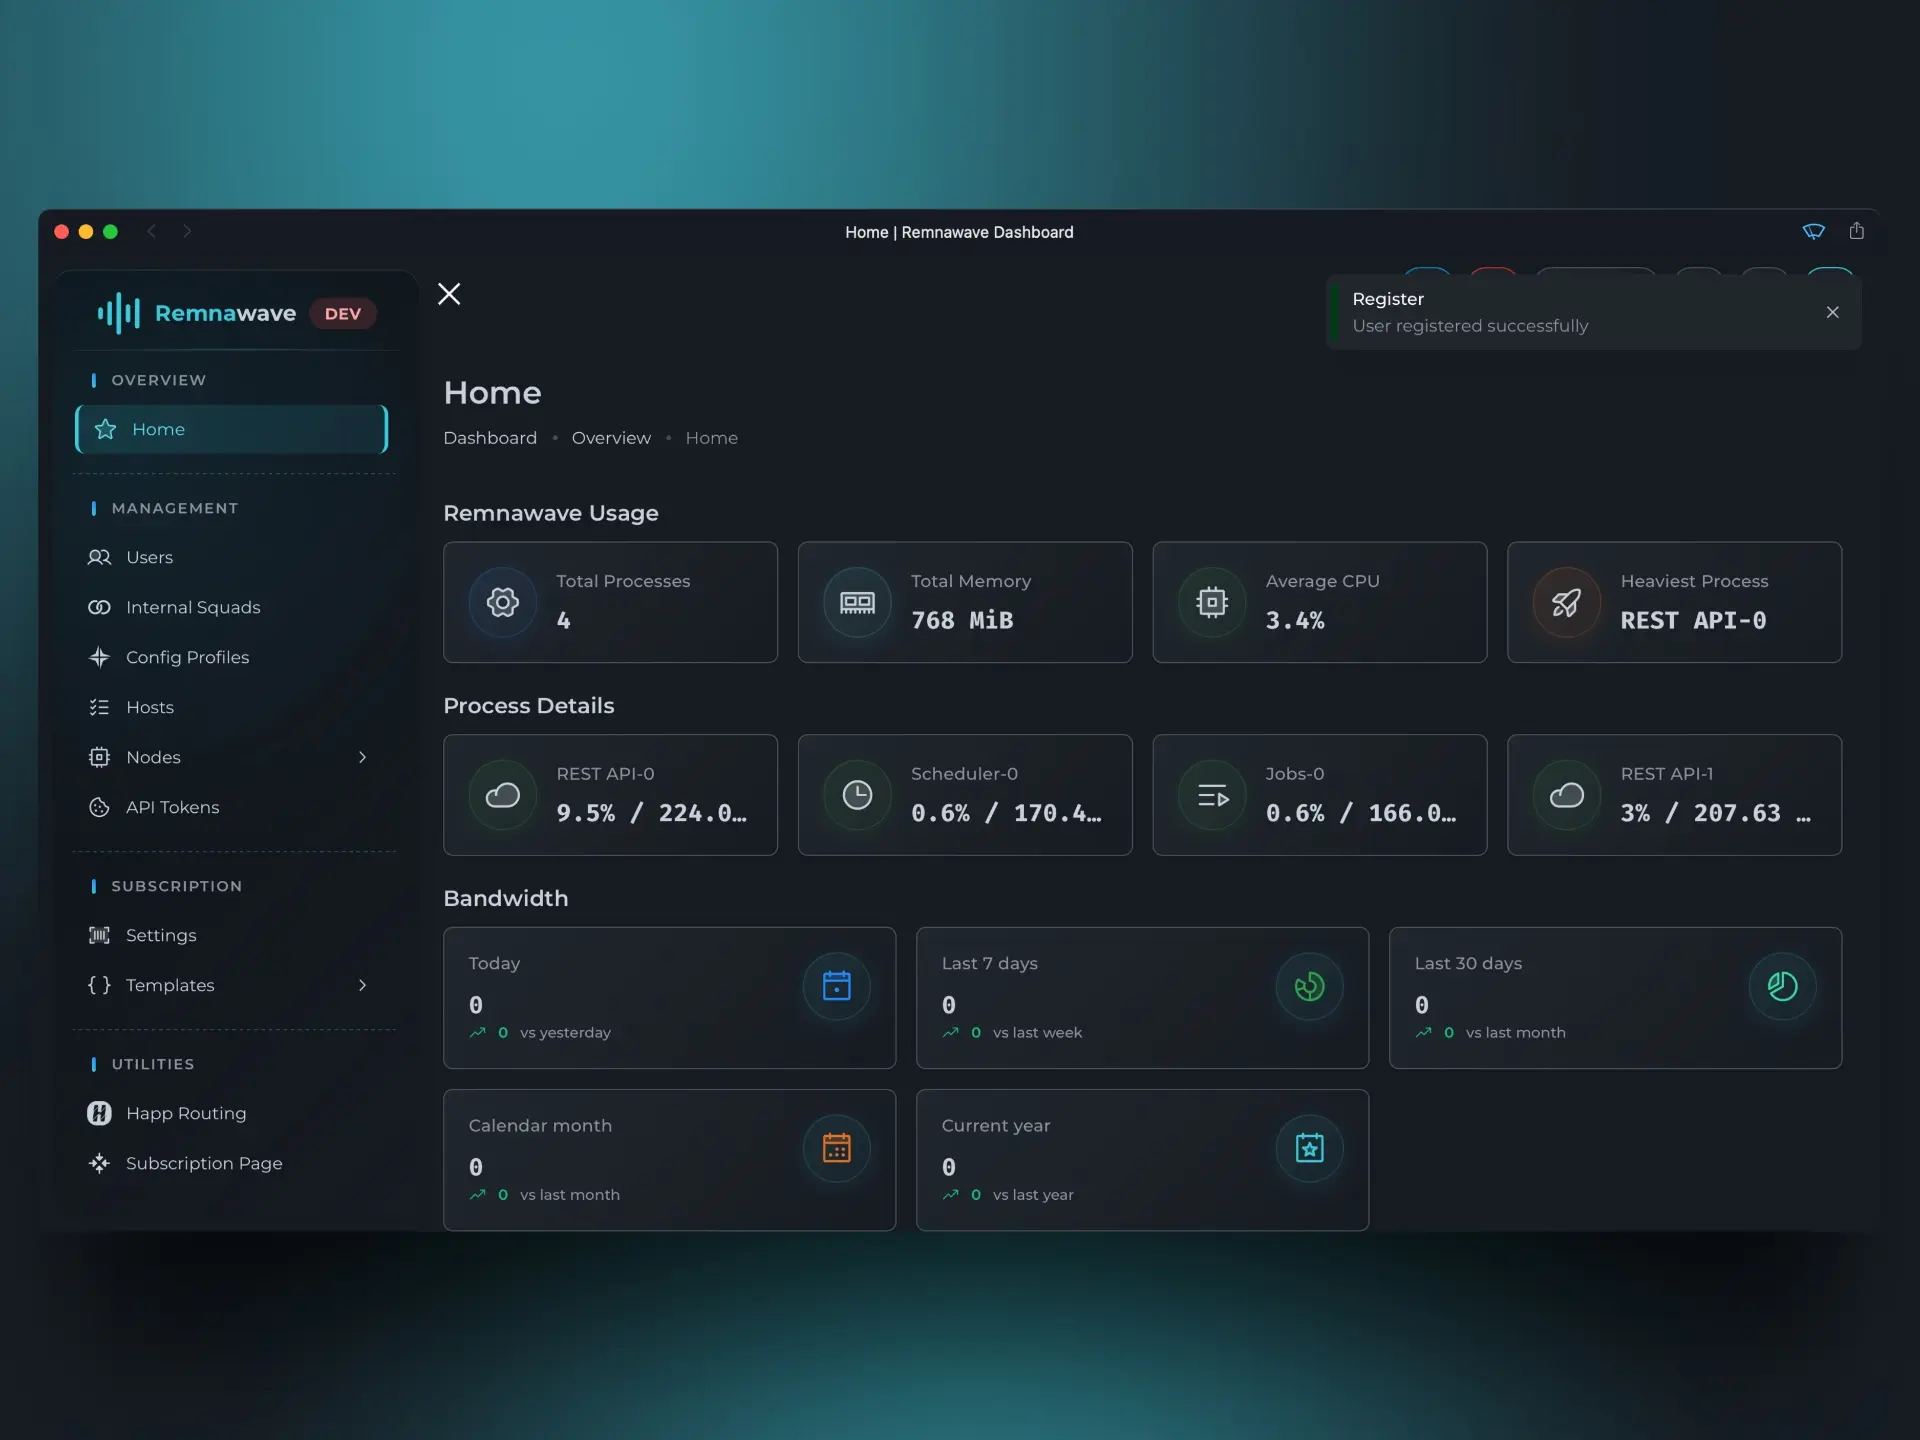
Let's break down the elements on this page.
Remnawave Statistics
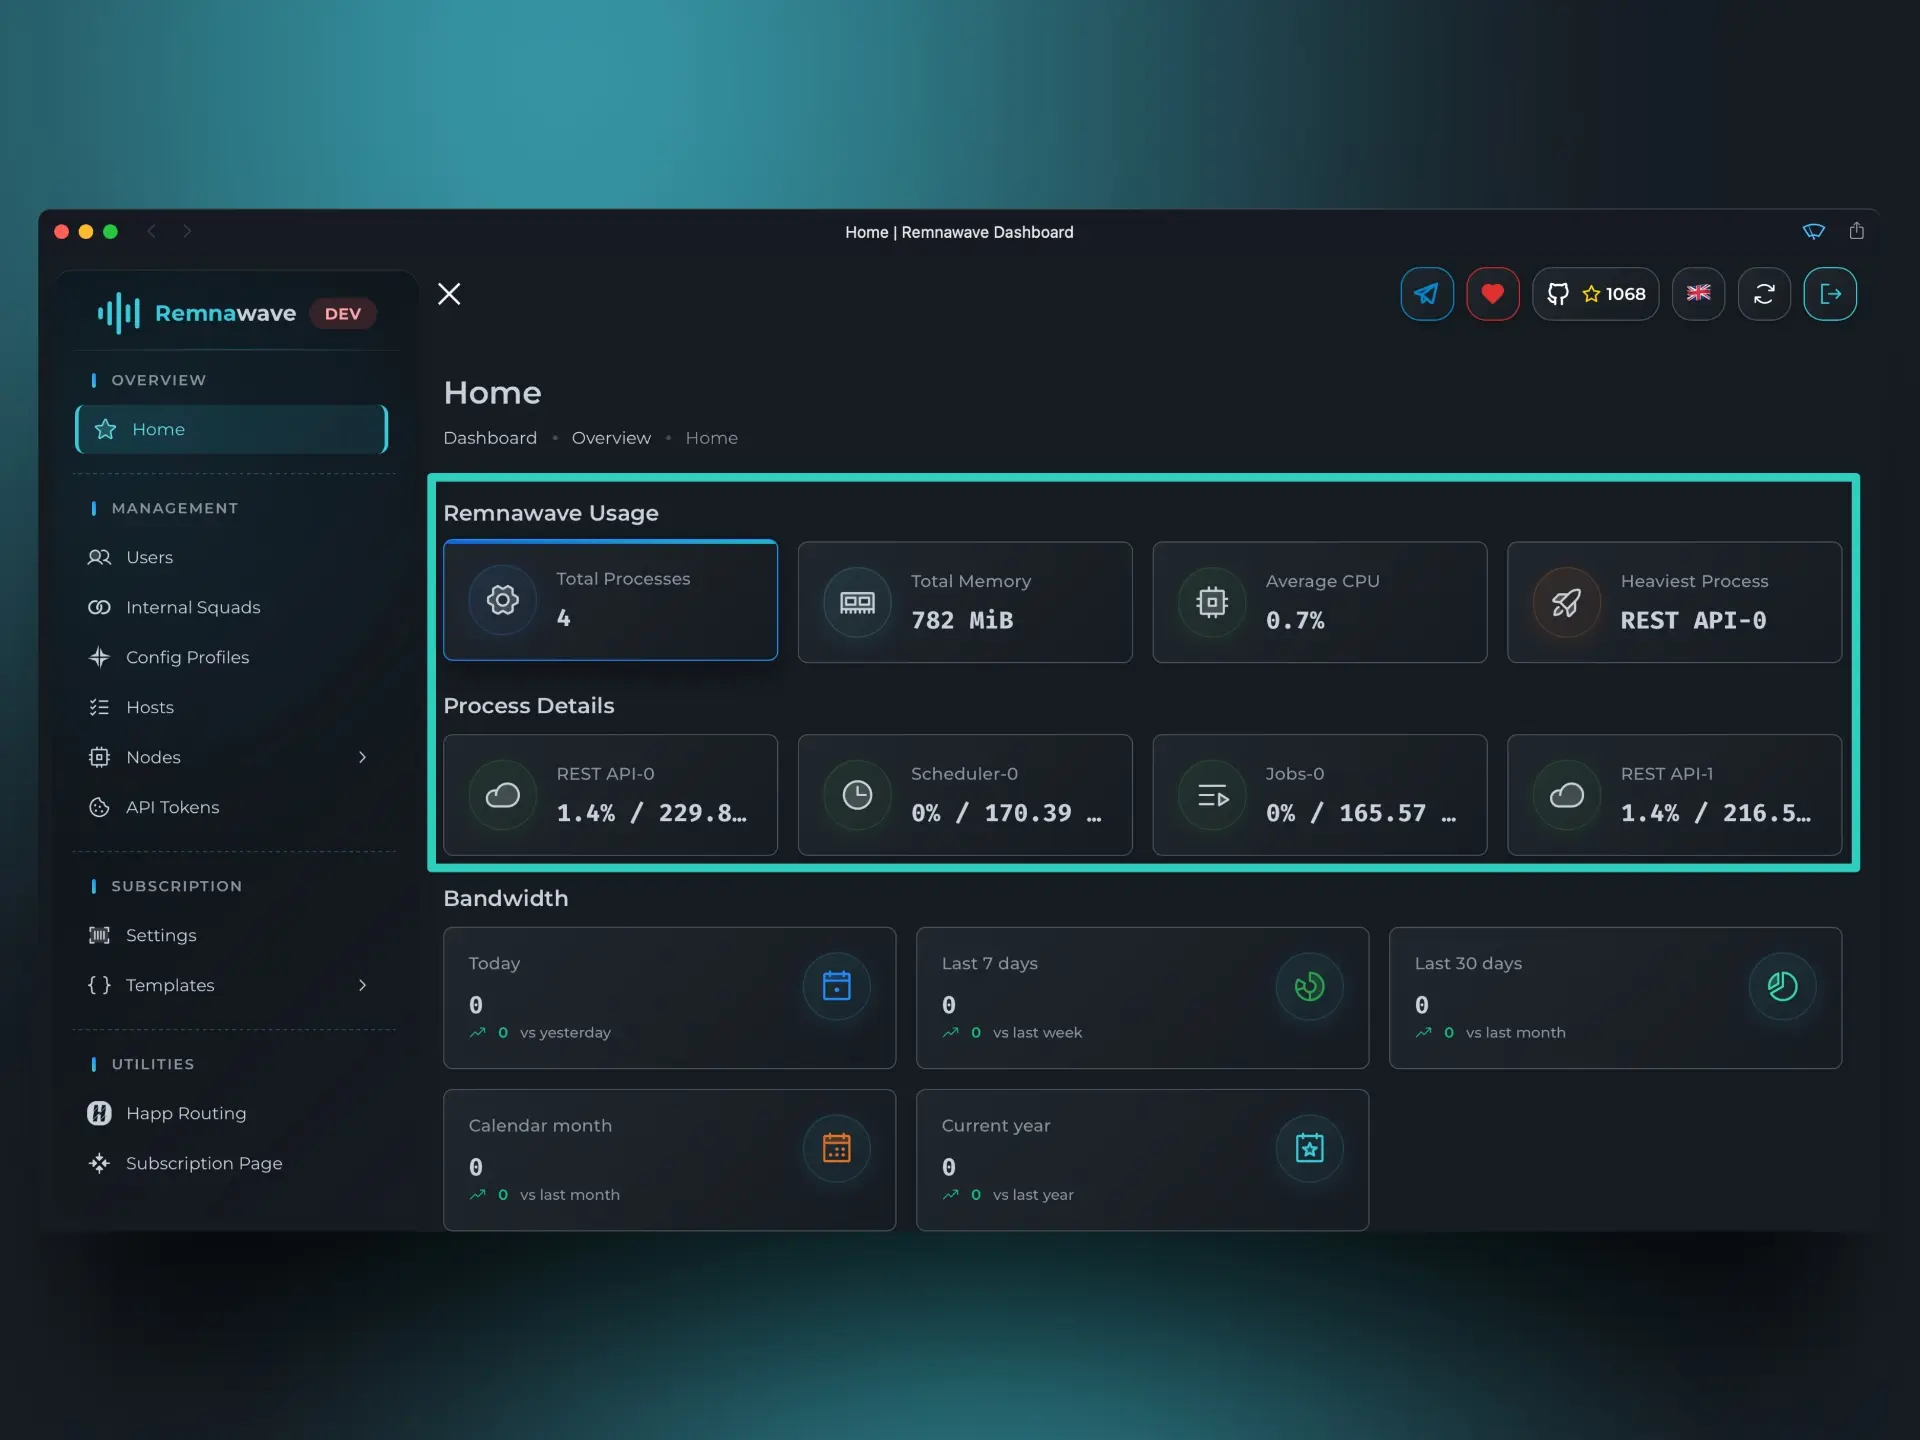
The first two blocks, Remnawave Usage and Process Details, show you how Remnawave is currently utilizing system resources.
In Process Details, you can see which internal Remnawave processes are consuming the most resources.
Depending on your configuration, there may be more than one REST-API process.
Bandwidth Usage
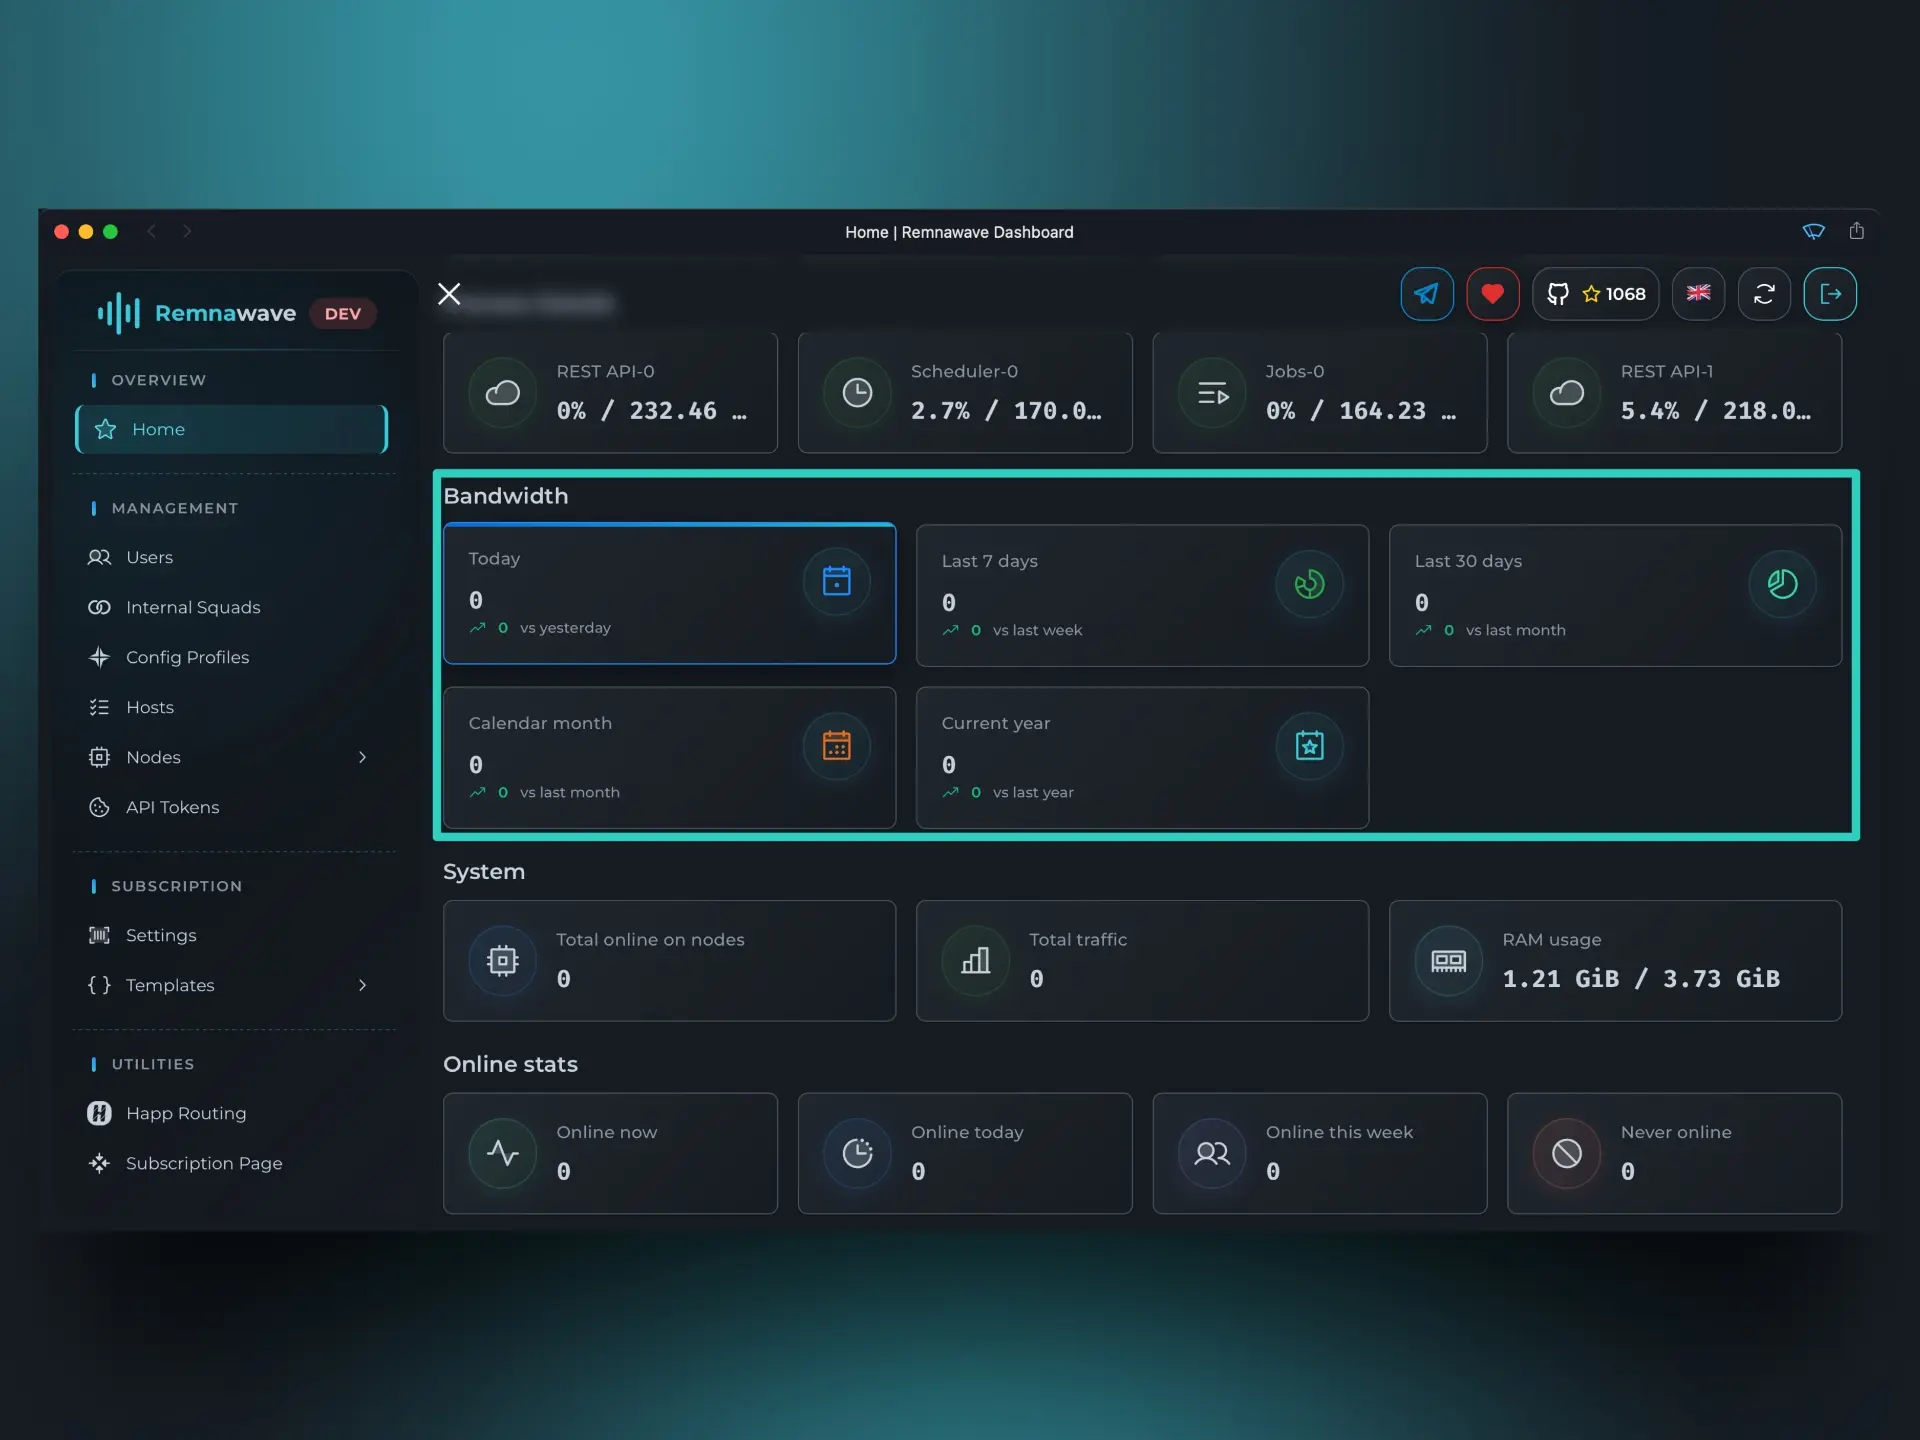
This block displays overall traffic usage statistics for all users, with a comparison to the previous equivalent period.
For example, let's consider the Today metric. If you open the Panel at 4:00 PM, this block will show statistics from 12:00 AM to 4:00 PM today. However, the comparison will be against the entire previous calendar day (from 12:00 AM to 11:59 PM).
Currently, the screenshot shows all zeros, but after we configure everything and connect a user, this block will reflect real data.
Users
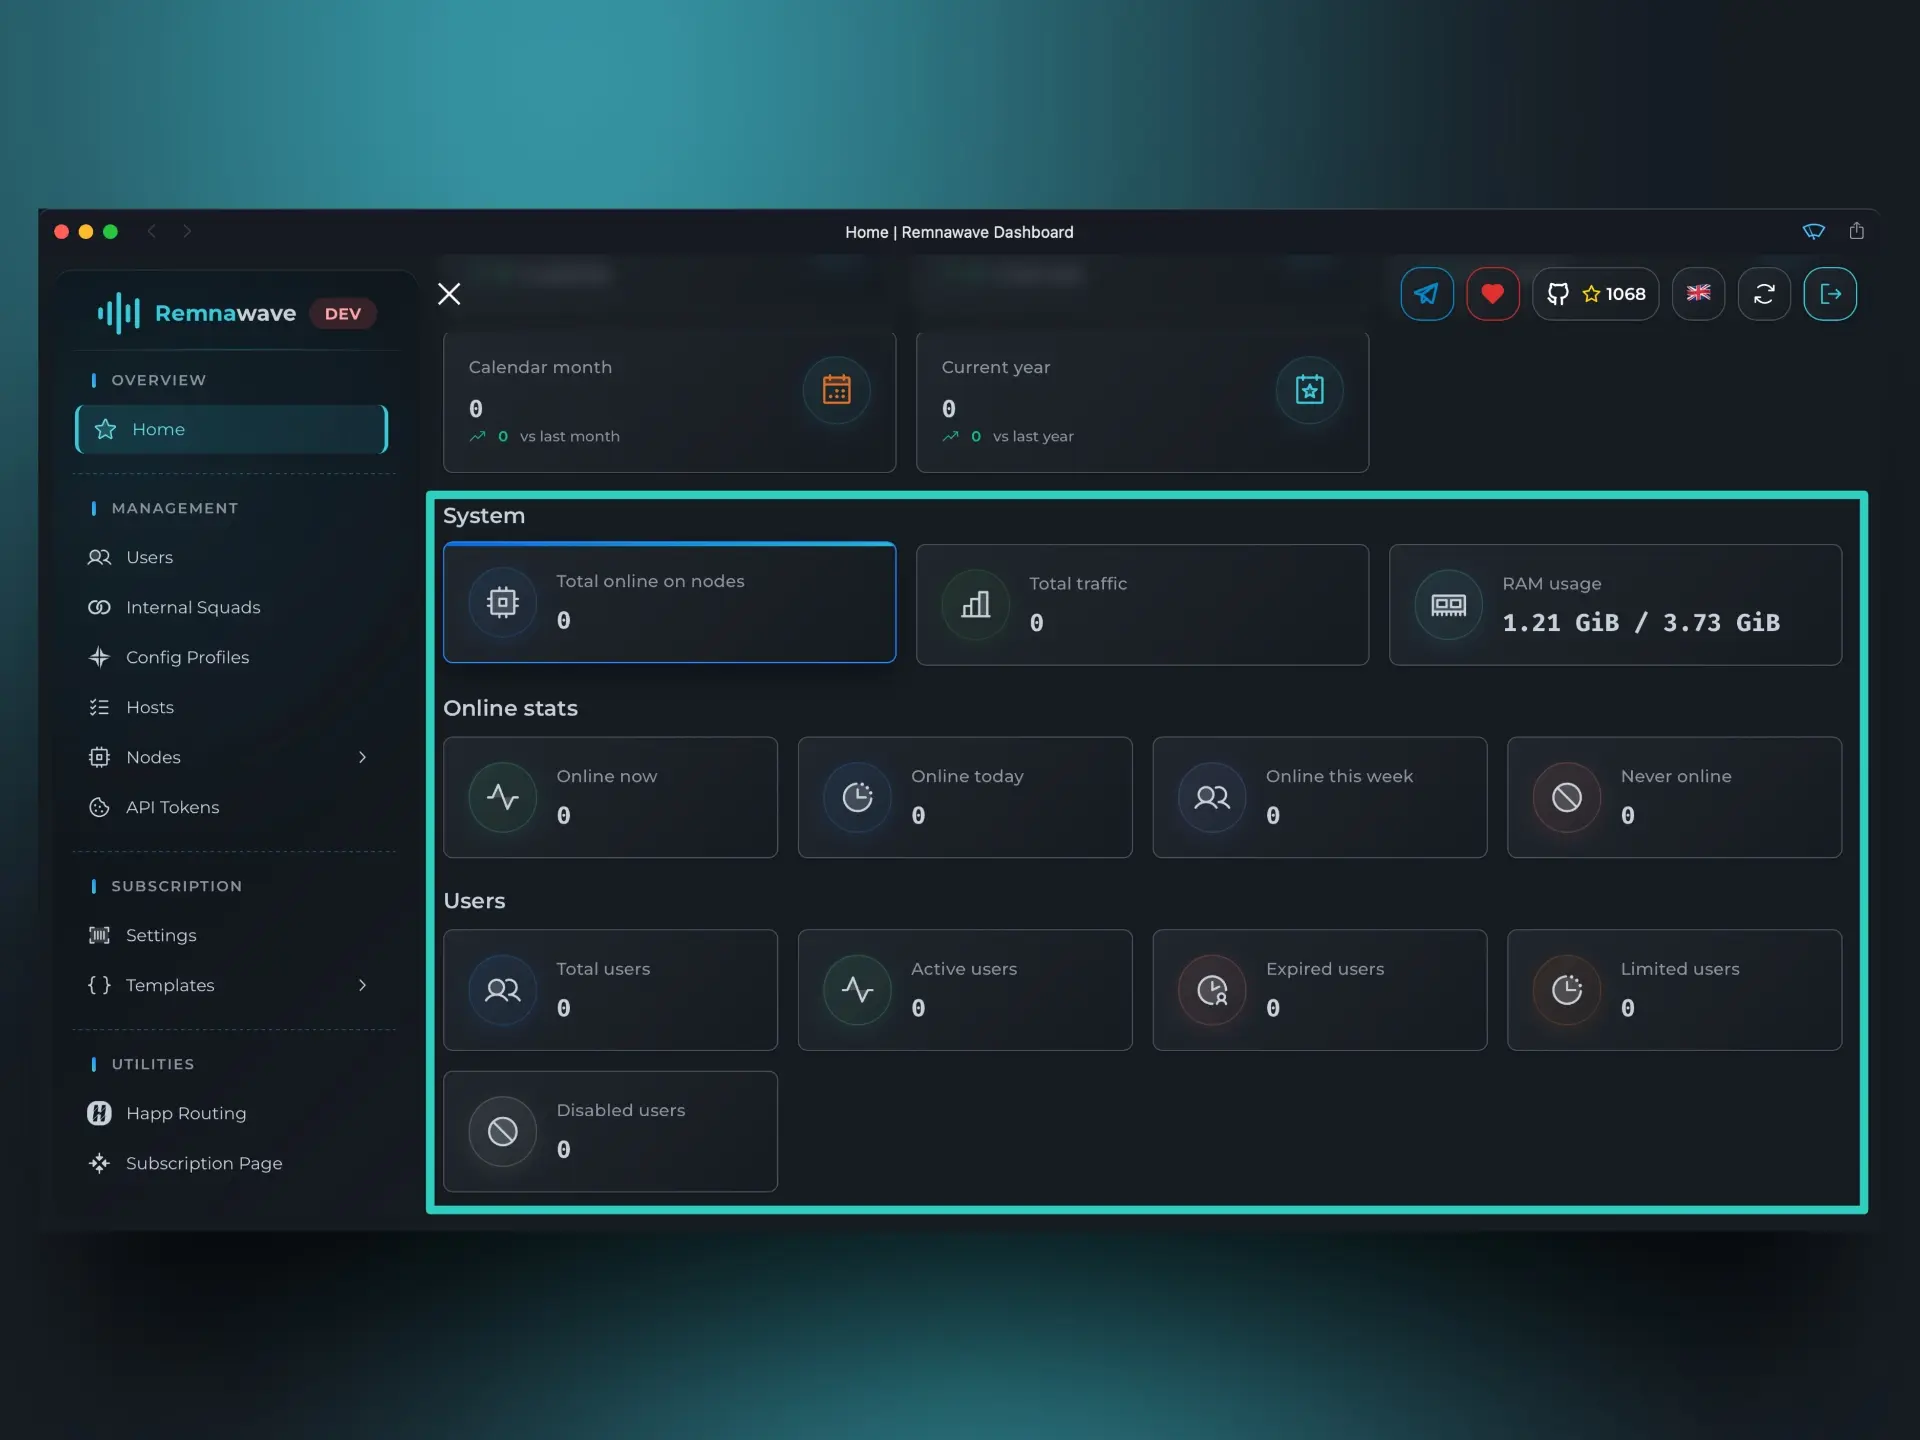
System→Total online on nodes- This displays the total number of online connections across all Nodes. A single user can be connected to multiple Nodes simultaneously. This figure represents the sum of all connections on all Nodes, including duplicates.
- For example: If User X is connected to Node A and Node B at the same time, this card will show 2 online connections.
Online stats- This block displays the total number of unique online users, not counting duplicates.
- For example: If User X is connected to Node A and Node B, this card will show 1 online user.
Users- This block shows general information about all users.
- For example: If you have two users — User X and User Z — the
Totalwill display 2. If User X has an active subscription and User Z’s subscription has expired, then theActiveandExpiredcounts will show 1 each.
Navigation Menu
On the left side you will see the navigation menu:
- Overview — Contains the
Homepage, which displays high-level statistics and system information. We covered this earlier in the guide. - Management — This is the core section of the Panel — you'll spend most of your time here. It includes:
Users- Create and manage Users.Internal Squads- Configure Internal Squads.Config Profiles- Create and manage Xray-core configurations.Hosts- Manage entry points for users.Nodes:Management- View, edit, disable, or delete Nodes.Statistics- Review detailed usage statistics per Node.Infra Billing- Track infrastructure costs.Bandwidth- Analyze traffic consumption across Nodes.Metrics- Access live telemetry from Prometheus.
API Tokens- Manage API access to your Panel.
- Tools - the section with useful tools for reviwing data collected by the Panel about your users.
HWID Inspector- View hardware IDs reported by client apps.SRH Inspector- Analyze subscription requests sent from client apps.
- Subscription - Configure what the client app receives when fetching the subscription.
Settings- Manage additional metadata sent to supported clients, such as Subscription Name.Templates- Define how the configuration is generated for the client apps' cores.
- Utilities - Tools designed to simplify and automate common tasks.
Happ Routing- A rule builder for creating and managing routing rules for Happ.Subscription Page- Customize the content of the Subscription Page.
📄️ Nodes
Once you’ve created a super-admin and explored the Home page, your next step is to set up your first Node.